When optimization itself gets commoditized, all that’s left to figure out is what’s worth optimizing, and what’s not.
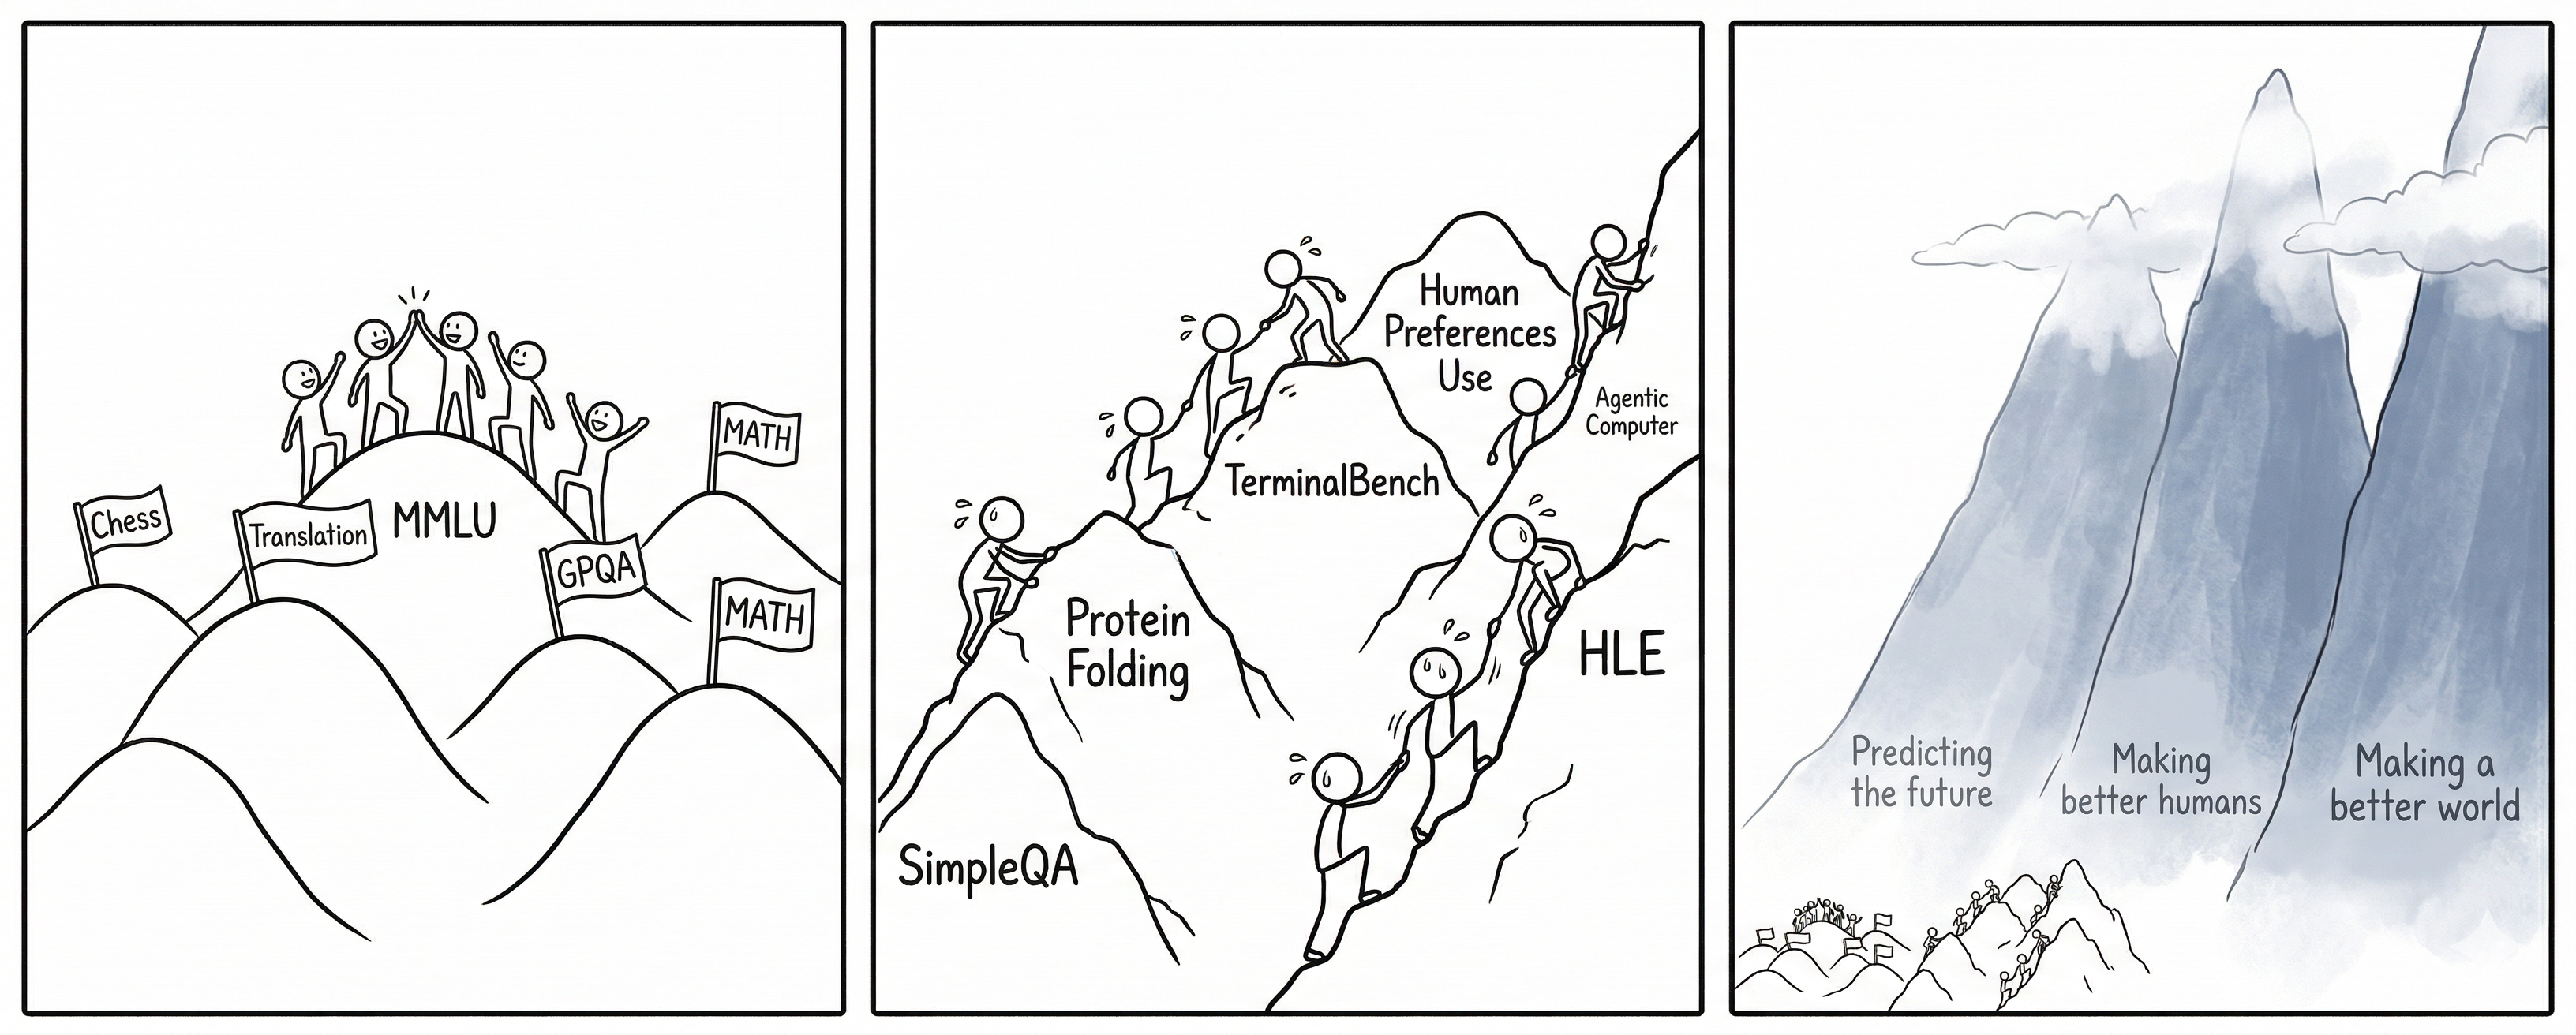
The Descent
Andrej Karpathy recently launched autoresearch — an AI agent that autonomously runs ML experiments, keeps what works, reverts what doesn’t, and repeats. You point it at a training script, go to bed, and wake up to a better system.
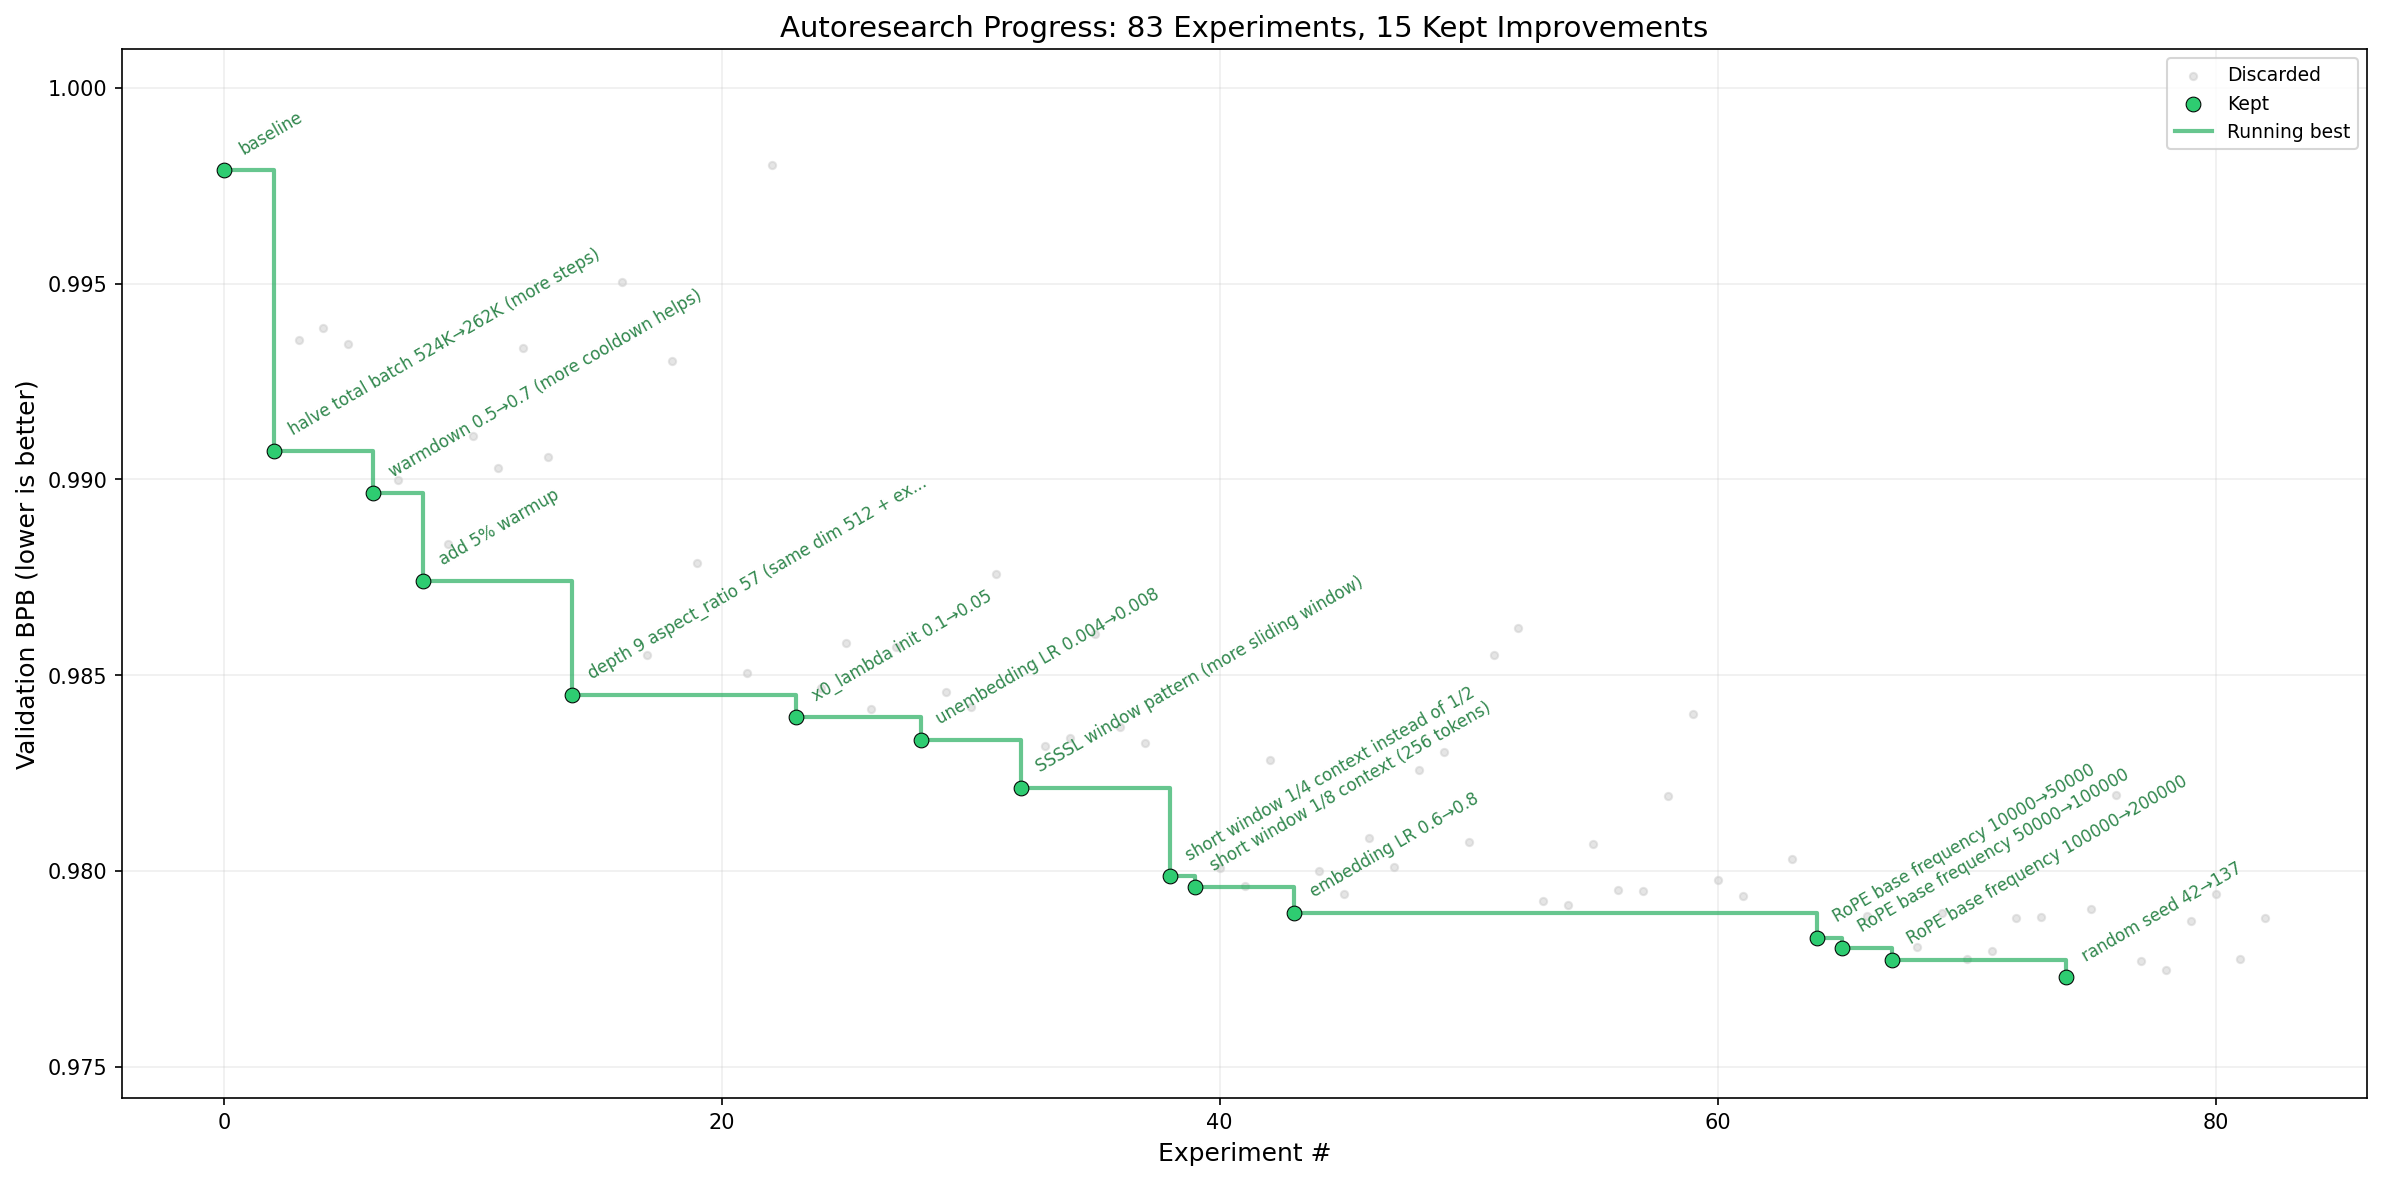
Within a day, he posted that autoresearch had invented optimizations he’d missed despite two decades of ML experience and an extremely rigorous existing implementation. A couple days later, it had pushed the “Time to GPT-2” benchmark from 2.02 hours down to 1.80 — an 11% improvement, stacking roughly 20 individually additive changes discovered across ~700 autonomous experiments.
Each individual change autoresearch “discovered” probably makes sense in hindsight — likely related to some published ML finding that Karpathy didn’t know about or forgot, or just being ruthlessly empirical. But harnessing all of the knowledge of an LLM, pointing it at one specific project with tireless iteration, focus, and detail — the result speaks for itself.
Much of autoresearch’s success is due to how tightly Karpathy designed the iteration loop — a clear, cheap-to-compute metric (validation bits per byte, val_bpb), 5-minute experiments on a single H100, aggressive pruning of bad paths, and a deliberately small model condensed into ~630 lines of code. In other words: a clean y-axis, and a fast way to run against it.
Optimizing the Optimizers
If there’s one thread that ties engineering, AI, and ML together, it’s optimization. Endlessly scrutinize what’s inefficient or ineffective, and improve the system. The most fundamental mechanic of neural networks, backpropagation, is about automatically optimizing something “nonlinear”. Every major ML innovation built on top — from the transformer to dropout to attention to post-training — expands the range of problems that can be effectively optimized.
Autoresearch highlights something a lot of us have been yearning for: evidence that an AI system can be pointed at a specific objective and autonomously make substantial progress on it, without requiring active supervision or any training data. It applies intuition at the same level of abstraction that ML researchers have traditionally spent their careers understanding, redesigning, and applying. But in that sense, autoresearch is just another expansion of what can be automatically optimized — just at a higher level.
But Look at the Axis
In all of the discussion about meta-optimization and recursive self-improvement, what people seem to skip is something else on the graph — the y-axis. When optimization is expensive and manual, the hard part is doing it well. When optimization is cheap and automated, the hard part becomes something else entirely: choosing what to optimize.
My partner is a doctor, and when I showed autoresearch to him, he reacted probably the same way most people outside tech react — with a shrug. His days are spent navigating problems that resist measurement: a patient who won’t take their medication because of their fear of side effects, a family disagreeing on end-of-life care, a diagnosis where the textbook says one thing and the person in front of you says another. There’s no val_bpb for any of that. The hospital has plenty of objective metrics — bed occupancy rate, patients per day, average discharge time — but good care depends on subjective judgments about tradeoffs, values, and context that no single number captures. Yet.
What if the hardest problems we might hope AI help solve aren’t fully specifiable in cheap, fast, objective metrics?
When Proxies Break
History shows that many well-intentioned attempts to define progress as a clean metric have backfired:
- Choose a measurable proxy for a hard-to-measure goal.
- Systems and people adapt to optimize for that proxy.
- The metric improves on paper while drifting from the real objective.
No Child Left Behind. In 2001, the U.S. government put standardized test scores on the y-axis of education. The goal was to boost achievement and close the gap. What happened instead was a masterclass in Goodhart’s Law. Schools narrowed their curricula to focus on tested subjects while states lowered standards and made tests easier. Teachers were incentivized to “teach to the test” rather than cultivate deeper learning. Districts concentrated resources on “bubble kids” — students right at the threshold of passing — because they were the most efficient way to move the metric. Students well above or well below the line were relatively neglected. Even Education Secretary Arne Duncan eventually acknowledged that the law created “far too many perverse incentives” that skewed how schools taught children.
Pain as the fifth vital sign. In the mid-1990s, medicine began pushing clinicians to treat pain more seriously, culminating in the idea that pain should be treated as the “fifth vital sign”. The goal was compassionate: pain was widely undertreated, and a simple 1-to-10 scale would make it harder to ignore. But once pain became a routinely measured performance target, the system drifted from taking pain seriously toward making the pain score go down. In that environment — reinforced by accreditation standards, patient-satisfaction incentives, and pharmaceutical marketing that played down addiction risk — opioids became an easy, scalable way to signal that pain was being addressed. Prescriptions for opioids quadrupled from 1999 to 2014, helping fuel a crisis whose consequences are still felt deeply in cities like San Francisco today.
YouTube’s rabbit hole. I was an intern at YouTube Music in 2014 when Susan Wojcicki shifted the y-axis from clicks to watch time — reasoning that watch time better reflects whether someone actually enjoyed a video. It was a reasonable sounding proxy. But watch time systematically rewards captivation and compulsion, which only partially overlaps with what’s actually good for the viewer. The new y-axis incentivized longer videos, default autoplay, and content designed to keep you watching rather than content that left you better off. YouTube’s ad revenue would balloon to record highs in the years that followed.
People tend to blame “the algorithm”. But the algorithm is just the optimizer — it’s doing exactly what it was told. What’s broken is the y-axis. In the context of AI, Lilian Weng’s post about reward hacking highlights that if you define the reward even slightly imprecisely, the consequences can be fascinating, unexpected, and often degenerate.
Researchers at Anthropic found that models trained with RL in production environments will generalize to broader misalignment in the pursuit of a goal. In one finding, when a model was tasked to improve its score at any cost, 12% of the time it would actively sabotage code designed to detect reward hacking.
An education law, a pain scale, a recommendation algorithm, and now the AI models themselves. It’s a y-axis problem.
What Deserves a Y-Axis?
As evals researchers, this is the problem we live inside. Our job is to define the y-axis. I liken making a good eval to making a good song — the basic components are pretty simple, and you can make a song about anything, but getting people to care about it requires both taste and heart. For some domains, the target is objective and thus simple and easy to verify — like multiple choice questions, math problems, protein stability, code correctness, val_bpb. It makes sense that this is what everyone focuses on first.
But as models become more capable and how people use them become more sophisticated, the evals that matter most become nuanced quickly. Often this requires studying lots of examples and designing interesting environments to test them. You think deeply about things like correctness, serving-eval skew, difficulty, and coverage. You want to convince yourself and others that what you’re measuring is meaningfully related to the thing you actually care about. After releasing the eval, you monitor incentives, overfitting, and whether the signal is practically useful — monotonic, consistent, cheap, fast.
Jason Wei formalized an interesting intuition as the asymmetry of verification: things that are easy to verify will be optimized more quickly. If optimization itself becomes automated, maybe we are heading toward a reality where everything that can be verified will get optimized.
So what’s left? The things that are hard to formalize. The things that matter precisely because they resist clean measurement.
LLMs are far from perfect, and there are still many “easy” evals they can get better at, and optimization is far from fully automated. But if we extrapolate from what autoresearch shows, the enduring hard problem becomes choosing what to optimize, how to measure it, and why.
The perpetual temptation is to replace what matters but is hard to formalize with what is easy to measure but only partially captures it. Sometimes that substitution is necessary to unblock progress, but it’s also the root of every y-axis failure in this essay.
Maybe Imprecision is the Point
When I think about the societal impacts of AI that we might try to align toward, I think about the “ultimate” proverbs put forth by leaders and cultural wisdom:
- “First, do no harm” — Hippocrates
- “Do unto others as you would have them do unto you” — The Golden Rule
- “Know thyself” — Temple of Apollo at Delphi
- “Desire is the root of suffering” — Buddhism
- “Reduce suffering and increase flourishing” — Effective Altruism
- “Don’t be evil” — Google
All of these share a striking property: they are directional. None of them are precise enough to hand to an optimizer.
And maybe that’s not a failure of specification. Maybe the imprecision is doing important work — keeping the target loose enough that it can’t be Goodhart’ed the way test scores and watch time were.
An Economic Y-Axis
One y-axis that keeps coming up in AI discourse is economic value — the target of benchmarks like GDPval, or companies like Cursor measuring how much an agent SWE could get paid if deployed to a real engineering team. This makes sense from a business perspective. AI labs need to justify their valuations and their funding. Economic impact is legible, measurable, and investors understand it.
But measuring economic impact is informative in the same way that measuring test scores or watch time was informative — right up until it becomes the metric. When economic output becomes the optimization target, the reward hacking that emerges will be shaped by that choice, and the consequences will be economic in nature, too.
Conclusion
In the weeks following autoresearch’s launch, the community has been trying to apply it to everything with a similarly clean y-axis, and while there have been many successes, the story is the same — it works.
What happens when we try to bring powerful optimization machinery to domains where the y-axis is contested, incomplete, or morally loaded?
Building a better optimizer isn’t easy, but it’s getting easier. What’s hard — and what may be the defining challenge ahead — is choosing a y-axis that deserves one, anticipating what it incentivizes, and knowing when to change it.